无人机任务
无人机任务
场景
Scenario: A drone is mounted with an internal GPS system and a 1D spinning LIDAR (something like this http://www.slamtec.com/en/lidar/a1). Every time the drone changes direction, the LIDAR does 1 full scan (sweep) of its surroundings. Our goal is to use the LIDAR data to improve the drone’s navigation. For this assignment altitude and drone orientation can be ignored. You can also assume that the scan is so fast that you can treat the drone as stationary for each sweep. One flight’s worth of data is provided consisting of $N$ sweeps over $x$ seconds.
场景:一架无人机配备了内部GPS系统和一个一维旋转LIDAR(类似于这个:http://www.slamtec.com/en/lidar/a1 )。每当无人机改变方向时,LIDAR都会对其周围环境进行一次完整的扫描(扫描一圈)。我们的目标是利用LIDAR数据来改进无人机的导航。在本次任务中,可以忽略无人机的高度和方向。此外,可以假设扫描速度足够快,以至于在每次扫描期间可以将无人机视为静止的。提供了一次飞行的数据,其中包含N次扫描,持续x秒。
任务
Tasks: For this assessment complete any 2 of the following Tasks. It is recommended that you pick 2 Tasks that assist each other. Any language may be used however Java, C#, C++ or Python are preferred. You may use prebuilt libraries for any of your data processing if you wish.
任务:在本次评估中,请完成以下任务中的任意两个。建议选择能够相互辅助的两个任务。可以使用任何编程语言,但推荐使用 Java、C#、C++ 或 Python。如果需要,您可以使用预构建的库来处理数据。
Display: Create a program to provide an appropriate visualization of the drone’s path and the LIDAR data. Ideally, the display should be able to show 1 sweep (1 scan ID) of data in isolation as well as all the sweeps combined together. This can be on separate displays or on the same display (with individual sweeps shown by highlighting for example)
Input: LIDARDPoints.csv and FlightPath.csv (provided or created from another Task)
Output: On-screen display
显示:编写一个程序,以适当的方式可视化无人机的飞行路径和LIDAR数据。理想情况下,显示应能够单独呈现一次扫描(1个扫描ID)的数据,以及所有扫描数据的整体可视化。这可以在不同的显示界面上实现,也可以在同一界面上实现(例如,通过高亮显示单次扫描)。
输入:LIDARDPoints.csv 和 FlightPath.csv(提供的数据或由其他任务生成)
输出:屏幕显示
Simulation: Generate new LIDARDPoints data based on a new room layout and new plausible flight plan. This data is not provided so you will need to create the layout and flight plan yourself. This can either be done manually (ensure you include your data with your submission) or programmatically.
- Input: Mapping.csv and FlightPath.csv (created, you may also use a map that matches the sample data provided however you will first need to generate this file [from part 5 for example]).
- Output: LIDARDPoints.csv
模拟:基于新的房间布局和新的合理飞行计划生成新的LIDARDPoints数据。由于未提供该数据,因此您需要自行创建房间布局和飞行计划。这可以手动完成(请确保在提交时包含您的数据),也可以通过编程方式生成。
输入:Mapping.csv 和 FlightPath.csv(需要创建,您也可以使用与提供的示例数据匹配的地图,但首先需要生成此文件(例如从第5部分生成))
输出:LIDARDPoints.csv
Flight optimization: Based on the data provided, find a better flight path that will result in the shortest possible travel time but still goes through the existing rooms. (Assume the first sampled location is the start point and the last sampled location is the end point).
- Input: LIDARDPoints.csv and FlightPath.csv (provided or created)
- Output: FlightPath.csv
飞行优化:于提供的数据,寻找一条更优的飞行路径,使其在仍然经过现有房间的前提下,实现最短的旅行时间。(假设第一个采样位置为起点,最后一个采样位置为终点)。
输入:LIDARDPoints.csv 和 FlightPath.csv(提供的数据或自行创建)。
输出:FlightPath.csv
Flight reroute: Based on the data provided, find an alternative route that will take you to the end point faster. You may go through different rooms.
- Input: LIDARDPoints.csv and FlightPath.csv (provided or created)
- Output: FlightPath.csv
飞行路线重规划:基于提供的数据,寻找一条替代路线,使无人机更快到达终点。可以经过不同的房间。
输入:LIDARDPoints.csv 和 FlightPath.csv(提供的数据或自行创建)。
输出:FlightPath.csv
Mapping: Use the multiple data sweeps to map out the dimensions of the rooms.
- Input: LIDARDPoints.csv and FlightPath.csv (provided or created)
- Output: Mapping.csv
映射:利用多次数据扫描来绘制房间的尺寸。
- 输入:LIDARDPoints.csv 和 FlightPath.csv(提供的数据或自行创建)。
- 输出:Mapping.csv
格式要求
Format:
- Program IO: As input, your program should take a path to the CSV files you will use as an input. As output, if the result is a data outputting Task, should be a csv, otherwise, if the Task is a visualization Task, it should display as it runs.
- File Format: Each time the drone takes a sample of data it generates a unique corresponding scan ID. This ID is shared between files and you can link location and lidar data using it.
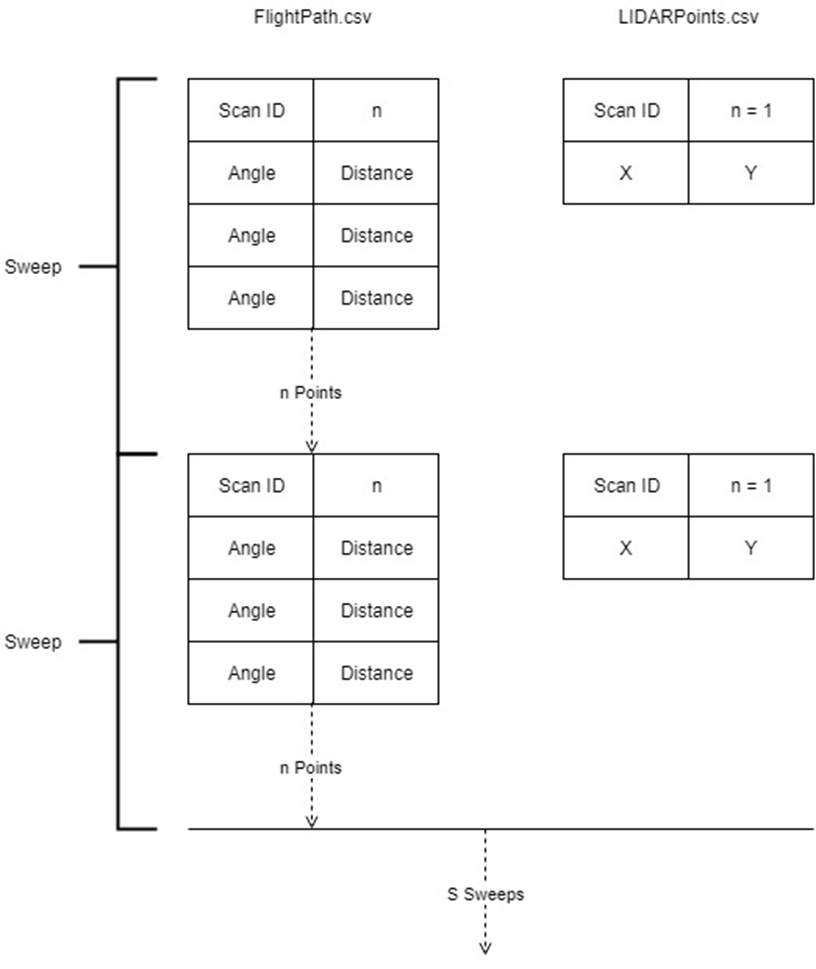
- FlightPath: FlightPath data is provided (and should be written in if you generate it) as a CSV file. The first line has the scan ID and number of data line (always 1). The next line is the X,Y location of the drone in meters.
- LIDARDPoints: LIDARPoints data is provided (and should also be the output format, if you generate LIDAR data) as a CSV file. The first line has the scan ID and number of data lines (number of recorded points for that sweep). Each following line has the angle of the data point (in degrees) and the distance (in millimeters) until the next scan ID header line. 34 sweeps are included.
- Mapping: If you generate a map of the rooms (Task 5) the results should be printed to a csv file. Each line of the file should represent one wall in the building. Each wall should be represented by its start and end point in millimeters (xstart, ystart, xend, ystart).
格式要求:
- 程序输入/输出(Program IO):作为输入,程序应接受要使用的 CSV 文件的路径。作为输出,如果任务涉及数据输出,则应生成 CSV 文件;如果任务是可视化任务,则应在程序运行时进行显示。
- 文件格式(File Format):每次无人机采样数据时,都会生成一个唯一的扫描 ID,该 ID 在不同的文件中共享,可用于关联位置信息和 LIDAR 数据。
- FlightPath(飞行路径):该数据以 CSV 文件格式提供(如果生成新数据,也应以相同格式写入)。第一行包含扫描 ID 和数据行数(始终为 1)。第二行记录无人机的 X、Y 位置(单位:米)。
- LIDARDPoints(LIDAR 数据点):该数据以 CSV 文件格式提供(如果生成新的 LIDAR 数据,也应以相同格式输出)。第一行 包含扫描 ID 和数据行数(即该次扫描记录的点数)。接下来的每一行记录数据点的角度(单位:度)和该方向上的距离(单位:毫米),直到遇到下一个扫描 ID 标题行。总共包含 34 次扫描数据。
- Mapping(房间映射):如果执行了任务 5(生成房间地图),结果应输出到 CSV 文件。文件中的每一行代表建筑中的一面墙。每面墙的表示方式:起点坐标(xstart, ystart)和终点坐标(xend, yend),单位为毫米。

解决方案
任务说明文件和相关数据保存在./task_related路径下
环境准备
- python3
- 安装pandas库(用于读取csv文件)
- 安装numpy(处理矩阵)
- 安装matplotlib(用于本任务绘图)
1 | pip install pandas |
部分任务实现
任务1
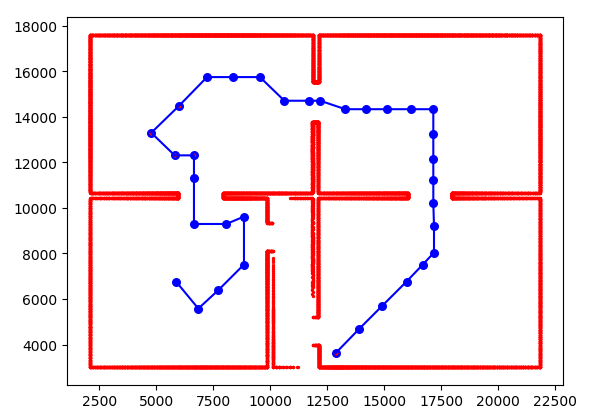
读取GPS坐标,使用matplotlib库实现绘制飞行轨迹。
读取雷达扫描信息,根据角度将据墙壁的距离映射到x和y轴上,与对应GPS坐标相加获得扫描点的坐标,使用matplotlib将所有扫描点进行绘制即可得到墙壁。
注意本任务中数据的特殊性,GPS坐标和雷达扫描坐标x轴一致,y轴方向相反。
任务5
- 从任务1中获取墙壁雷达扫描点的坐标,因为扫描点存在误差,因为忽略掉坐标的小数位和个十位,使同一面墙的扫描点位于同一直线上。
- 观察数据,墙壁只有x轴和y轴两个走向,分别按y轴方向和按x轴方向检测墙壁,以y轴方向为例。
- 扫描点坐标矩阵进行排序,使其按照x坐标由小到大排列,当x坐标相同时,按照y坐标大小进行由小到大排列。
- 遍历排序后的矩阵,将第一个点的坐标设置给x_start,y_start,遍历的过程中进行两种情况的判断:
- 判断1(x坐标变化):
- 当前点与上一个点x坐标是否相等,因为在检索y轴走向墙壁,x坐标不相等则为不同墙壁
- 如不相等,继续判断上一坐标点的坐标与x_start,y_start的值是否相等以排除x轴走向墙壁的情况
- 当前点x坐标与上一点不同且上一点坐标与x_start,y_start不同,说明上一个点为墙壁的结束点,将上个点的坐标设置给x_end,y_end,将当前x_start,y_start,x_end,y_end进行保存,将当前点的坐标设置给x_start,y_start,继续遍历。
- 判断2(y坐标的差值):
- 当x坐标相同时,y轴差距过大,说明不是同一个墙壁
- 因为在进行数据预处理时,将坐标个十位和小数点忽略,因此在一个墙壁上的连续点的差值均为100
- 在遍历的过程中,用当前点y坐标减去上一个点的y坐标,其差值大于100则说明不在同一墙壁上,将上个点的坐标设置给x_end,y_end,将当前x_start,y_start,x_end,y_end进行保存,将当前点的坐标设置给x_start,y_start,继续遍历。
- x轴走向的墙壁探测思路与y轴相同,完成对x和y轴走向墙壁的探测,即可获取墙壁起止坐标的映射。
绘图工具类
1 | import matplotlib.pyplot as plt |
墙壁映射工具类
1 | import numpy as np |
主函数
1 | import copy |
结果展示
- 任务1结果
- 任务一图中,蓝色线为无人机飞行轨迹,蓝色点为无人机GPS定位点,红色墙壁由多个雷达扫描点组成。

- 任务5结果
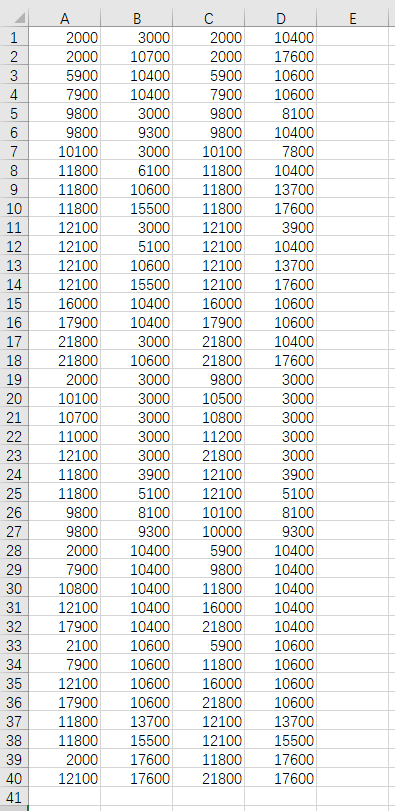
- 任务5图中,一行为一组坐标,其中A列为x_start,B列为y_start, C列位x_end,D列为y_end。
- 任务5的数据对应任务1中的红色墙壁,其中两个房间连接处较短的线段也被认为是一面墙壁,映射结果与图片展示结果是对应的。


